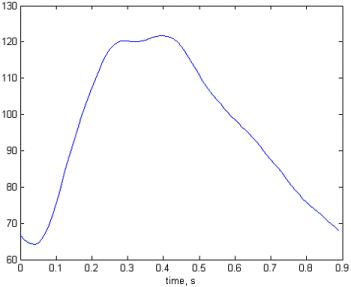
The cardiac flow profile shown opposite was applied to the model. The simulation was run for five cardiac cycles to allow the system to settle down, and the results for the last cardiac cycle are shown. The results given below compare a stiff artery model, in which the Young's modulus for all the arterial walls has been doubled, to the standard Westerhof model. Pressures are shown at the heart and at the right brachial artery.
The maximum pressures in the stiff artery model are higher. However, note also that the minimum pressures are lower, giving a much greater variation in pressure over the cardiac cycle for the stiff artery model. Additionally, the dichrotic notch in the brachical artery pressure trace is greatly reduced.


